https://unsplash.com/photos/white-printing-paper-with-numbers-Wpnoqo2plFA?utm_content=creditShareLink&utm_medium=referral&utm_source=unsplash
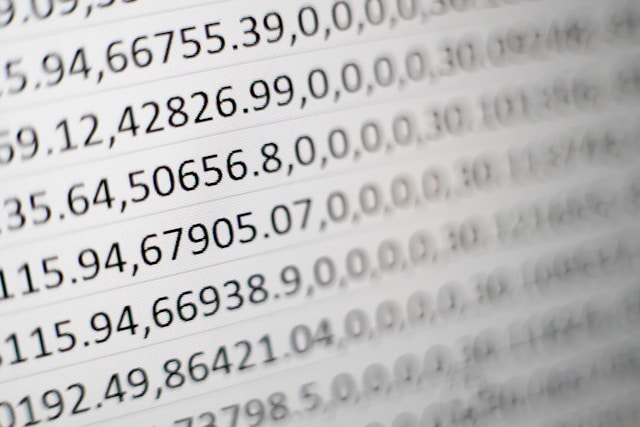
The following code in Perl performs the normalization of a dataset of numerical data. For each record, the fields (columns) must be separated by spaces, ignoring (considering as comments) the lines that begin with the characters # or %.
Invoking the program requires at least one argument: the path to the file containing the dataset to be normalized. If no arguments are specified, the syntax for its correct use is printed:
Usage: normalize-data.pl [ datafile ] [ z-score | min ( default 0 ) ] [ max ( default 1 ) ]
Normalization can be carried out in two different ways:
- linear scaling of each column of the dataset, in which case, the minimum (default 0) and maximum (default 1) values for rescaling must be specified in addition to the file name. For the value corresponding to the record i of column j, d_{ij}, and denoting with l and u respectively the minimum and maximum values for rescaling, the new value is calculated as:
d_{ij}'=\frac{d_{ij}-\min{d_j}}{\max{d_j}-\min{d_j}}(u–l)+l - Z-score, in which case the string “z-score” must be provided as the second argument. The Z-score represents the number of standard deviations away from the mean. You would use z-score to ensure your feature distributions have mean 0, \overline{d_j}=0 and standard deviation 1, \sigma_j = 1. It’s useful when there are a few outliers, but not so extreme (a data point can be considered unusual if its z-score is above 3 or below -3):
d_{ij}’=\frac{d_{ij}-\overline{d_{j}}}{\sigma_{j}} In the case of z-scores, the means and standard deviations are calculated with the Statistics::Descriptive Perl package.
Once the execution is completed, the program creates the de-normalization-limits.dat file which contains the maximum and minimum values for each column of the original dataset in the case of linear scaling, or the values of the mean and standard deviation of each column in the case of Z-score mode. This file allows the reconstruction of the values generated by any predictive systems that use the dataset normalized in the units of the original dataset.
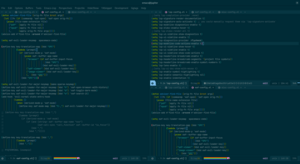
Code:
#!/usr/bin/perl -w

use List::Util qw[min max];
use Statistics::Descriptive;
use strict;

my ( $l, $u, $i, $j, @f, @max, @min, @sigma, @mu, $stats, @d, $val );

if ( @ARGV < 1 ) {
        print
            "Usage: normalize-data.pl [ datafile ] [ z-score | min ( default 0 ) ] [ max ( default 1 ) ]\n";
        exit;
}

$ARGV[1] = lc( $ARGV[1] );

if ( $ARGV[1] ) {
        $l = $ARGV[1];
} else {
        $l = 0;
}

if ( $ARGV[2] ) {
        $u = $ARGV[2];
} else {
        $u = 1;
}

open( IN, "$ARGV[0]" );

my $n = 0;

while (<IN>) {
        next if ( /^\#/ || /^\%/ );
        chop;

        @f = split(/\s+/);

        if ( $n == 0 ) {
                for ( $i = 0 ; $i < @f ; $i++ ) {
                        $max[$i] = -1e100;
                        $min[$i] = 1e100;
                }
        }

        for ( $j = 0 ; $j < @f ; $j++ ) {
                $d[$j][$n] = $f[$j];
                $max[$j]   = max( $max[$j], $d[$j][$n] );
                $min[$j]   = min( $min[$j], $d[$j][$n] );
        }

        $n++;
}

close(IN);

for ( $i = 0 ; $i < $n ; $i++ ) {
        for ( $j = 0 ; $j < @f ; $j++ ) {
                print "  " if ( $j > 0 );

                if ( $l eq 'z-score' ) {

                        # Standardization (z-score)
                        if ($i == 0) {
                                $stats = Statistics::Descriptive::Full->new();
                                $stats->add_data( $d[$j] );
                                $sigma[$j] = $stats->standard_deviation;
                                $mu[$j]    = $stats->mean;
                        }

                        $val =
                            ( $d[$j][$i] - $mu[$j] ) / $sigma[$j]; # Standardization (z-score)
                } else {
                        $val = ( ( $d[$j][$i] - $min[$j] ) / ( $max[$j] - $min[$j] ) ) *
                            ( $u - $l ) + $l; # Linear scaling
                }

                printf( "%+.6f", $val );
        }

        print "\n";
}

# Print statistics for each column in order to reverse normalization
open( DENORMALIZING, ">de-normalization-limits.dat" );

print DENORMALIZING
    "# ----------------------------------------------------------------------\n";
print DENORMALIZING "# Limits for de-normalization\n";
print DENORMALIZING
    "# ----------------------------------------------------------------------\n";

if ( $l eq 'z-score' ) {
        print DENORMALIZING
            "# Column             Mean                      Std.Dev\n";

        for ( $j = 0 ; $j < @f ; $j++ ) {
                printf( DENORMALIZING "#   %2d   %+.20e %+.20e\n",
                        $j + 1, $mu[$j], $sigma[$j] );
        }
} else {
        print DENORMALIZING "# Upper limit: $u\n";
        print DENORMALIZING "# Lower limit: $l\n";
        print DENORMALIZING
            "# ----------------------------------------------------------------------\n";
        print DENORMALIZING
            "# Column             Max                         Min\n";

        for ( $j = 0 ; $j < @f ; $j++ ) {
                printf( DENORMALIZING "#   %2d   %+.20e %+.20e\n",
                        $j + 1, $max[$j], $min[$j] );
        }
}

print DENORMALIZING
    "# ----------------------------------------------------------------------\n";

close(DENORMALIZING);

print STDERR
    "De-normalization limits written in file 'de-normalization-limits.dat'\n"